Lots of people think that template engines like Twig cannot be interactively debugged. I heard this several times as an argument against template engine, and for using legacy php processing like phptemplate (standard in Drupal 7).
Well, it’s not entirely true. And even more, debugging Twig is not only easy, but you will also get much more information about what your template is doing!
Are you not sure if you need to escape output string in template or if it’s already escaped “out of the box?” No worries: debugger tells you quickly, because you can debug the PHP scripts Twigs are compiled into (and see exactly what the script is doing with your variables).
A precondition for this how-to is completely performed in the previous episode of this series, Debugging Drupal 8 in PhpStorm. Part 2: Local Web-based Debugging in Mac OS X, Acquia Dev Desktop 2, and XDebug. This is where we describe how to set-up standard web-based debugging. In this article we will only describe some site-specific settings you must perform in Drupal 8 in order to debug PHP code generated by Twig templates.
- Enable local environment settings
- Enable Twig cache in
development.services.yml - Clear all caches, reload page, and locate folder "sites/default/files/php/twig"
It really makes sense to enable the settings below only for local environment. So firstly, we will setup the specific environment for local development only. If you have this done before, you can skip this step.
In your local sites/default/settings.php, ensure that the following piece of code is uncommented or added at the end of the file:
if (file_exists(__DIR__ . '/settings.local.php')) {
include __DIR__ . '/settings.local.php';
}
Ensure file sites/default/settings.local.php exists and following line is present there:
$settings['container_yamls'][] = DRUPAL_ROOT . '/sites/development.services.yml';
You will also need to disable render cache by uncommenting following line in sites/default/settings.local.php file:
$settings['cache']['bins']['render'] = 'cache.backend.null';
Open /sites/development.services.yml and ensure the following is present in the file:
services:
cache.backend.null:
class: Drupal\Core\Cache\NullBackendFactory
parameters:
twig.config:
debug: true
auto_reload: true
cache: true
Let’s explain this step a little: in fact, to enable Twig debugging, we only need to set “cache: true”. This assures that the Twig templates will be “cached” and generated into PHP files. And these PHP files are debuggable. In order to re-generate these PHP files after each page-load, we must disable caching by setting dummy “NullBackendFactory” service as a caching service, and by setting “auto_reload: true” as a Twig setting, so Twig will compile template files after each page load.
The “debug: true” setting is actually not necessary to be set, but it’s still very helpful. It will require a lot of HTML comments with information about the Twig file and the theme file name suggestions available.
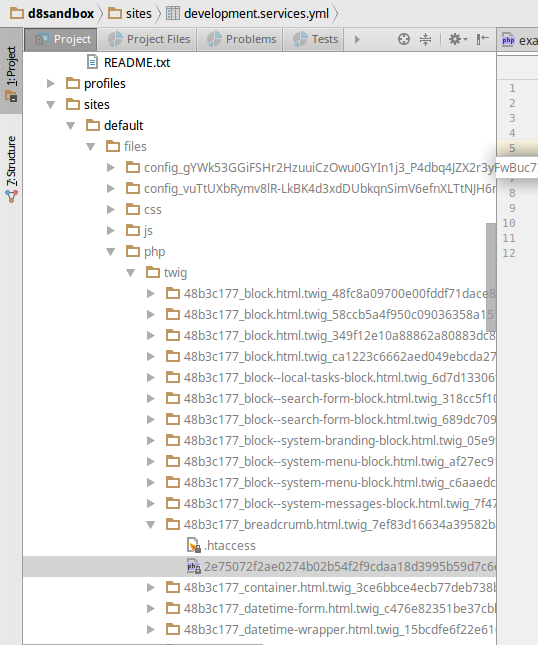
In this folder, you see all the generated PHP files from Twig templates. Locate a folder with a name that contains name of your Twig template you want to debug (e.g. “..._breadcrumb.html.twig_”).
Open the PHP file with a long hashed filename inside of this folder and set the breakpoint at first line of the doDisplay() function:
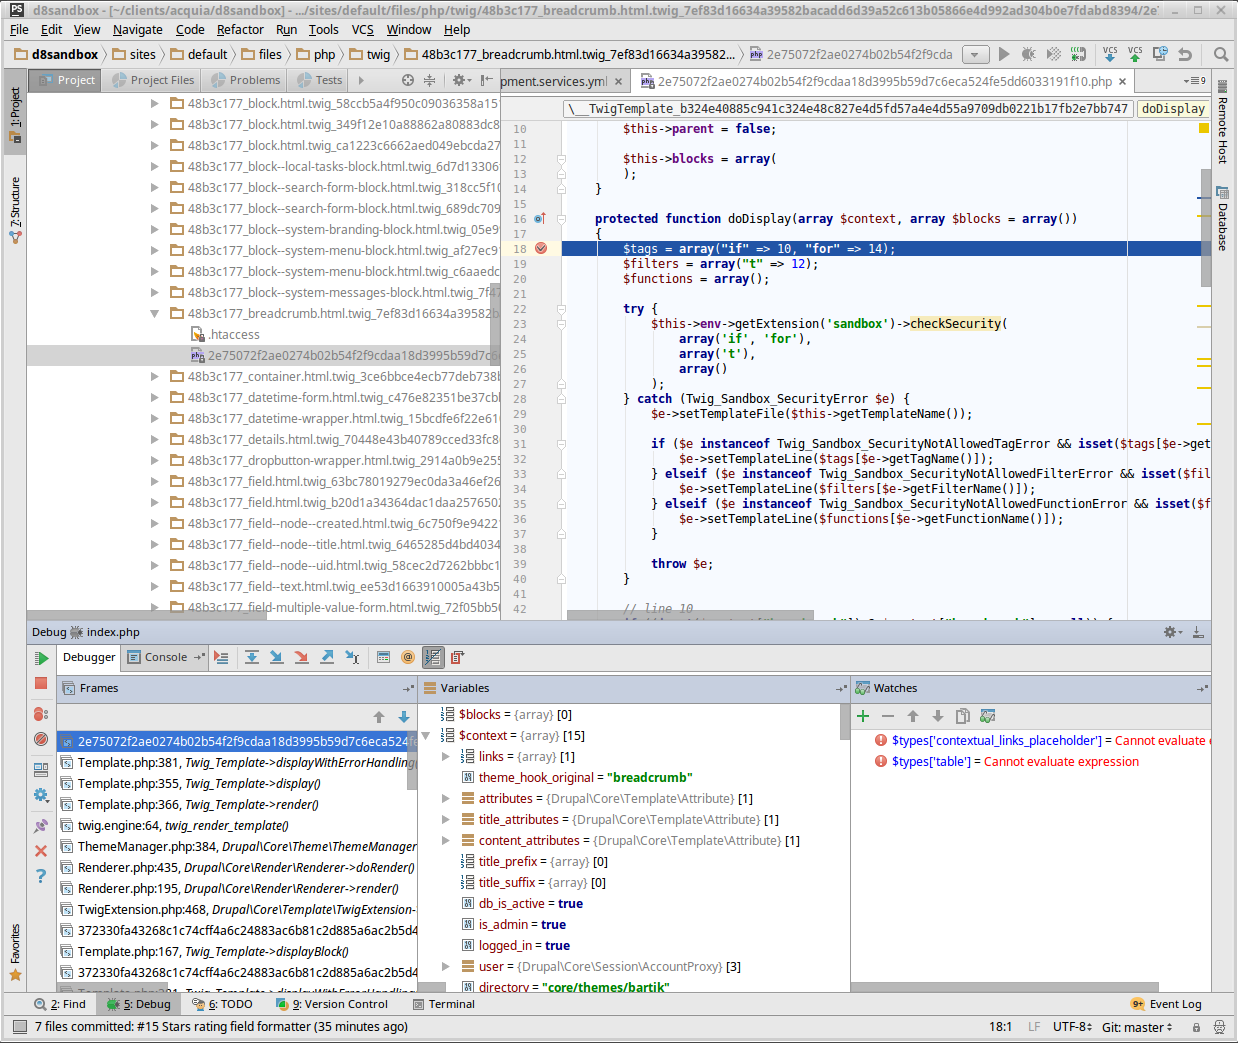
Note: if you see more than one php file in this folder, set a breakpoint to all php files at the same place inside doDisplay function - see last bullet below for closer explanation why.
Refresh the page, and PhpStorm should be stopped at the position inside the doDisplay function. Voila! :)
Some additional useful information:
- Inside of “context” variable you actually see all the variables assigned to template. E.g. in
breadcrumb.html.twig, the “breadcrumb” variable assigned to the template is shown under$context[‘breadcrumb’]: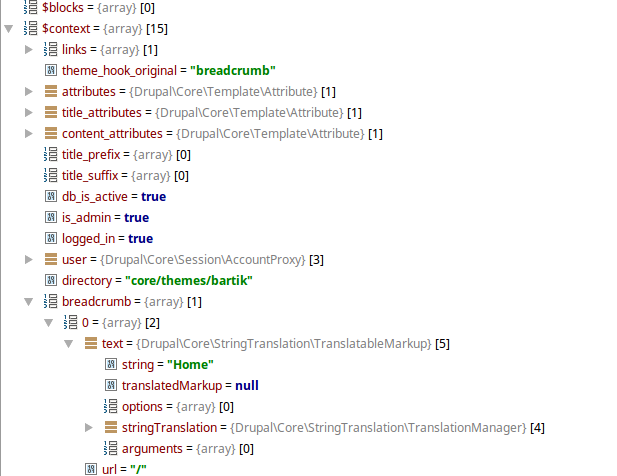
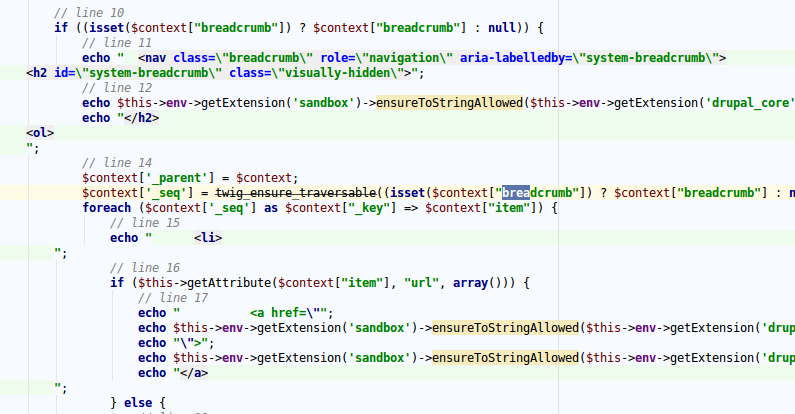
- By checking and iterating through the code you can easily see what preprocessors is Twig using to output the variable, and also the line numbers that correspond to lines in the Twig template. Thanks to this, you can easily read if the output is e.g. escaped and even get inside of the escape method to see the details, if necessary:
- Remember that you are debugging generated php files. This has some implications in comparison to “usual” php files:
- After every template change the new php file is re-generated. This results in more than one php file in the generated folder of the Twig template. It may be confusing to determine the “actual” php file we want debug, as the generated php filenames are hashed. The quickest way to get around this is to set a breakpoint to all php files in the directory, at the beginning of
doDisplay()function. Then you should surely match one. - If you change anything in a Twig template, the corresponding hashed php file will be newly generated. To debug this file, you must firstly let the php file be generated (e.g. by reloading the page with a new template), then locate this newly generated php file and set the breakpoint inside.
- Clearing the cache removes all the folder contents completely. Thus, you must set all the breakpoints again to the newly generated php files. After cache clear the generated files are not writeable. All changes must be done inside of the Twig templates, not in the generated PHP files!
- After every template change the new php file is re-generated. This results in more than one php file in the generated folder of the Twig template. It may be confusing to determine the “actual” php file we want debug, as the generated php filenames are hashed. The quickest way to get around this is to set a breakpoint to all php files in the directory, at the beginning of