Acquia: Your Website's Protector
- 20 minute read
-
On Acquia’s Support team, we see all sorts of issues every day. Many are unique to the particular purpose and configuration of a site, but there are a variety of issues that can appear on even the most well-built and meticulously maintained web applications. We see these often enough that they are among the first things we look for when a site goes down or begins to experience specific symptoms, and we are often able to resolve them quickly precisely because we have learned from experience what will and what will not work.
Our experiences also help us understand what kinds of obstacles can cause issues down the road for a site, especially as it grows in popularity and becomes more complex. For these reasons, we are also able to provide targeted guidance to sites before launch or after to ensure that everything works properly and pages load quickly.
Here are some of the common issues we see on a daily basis which we are often able to quickly diagnose and help to resolve.
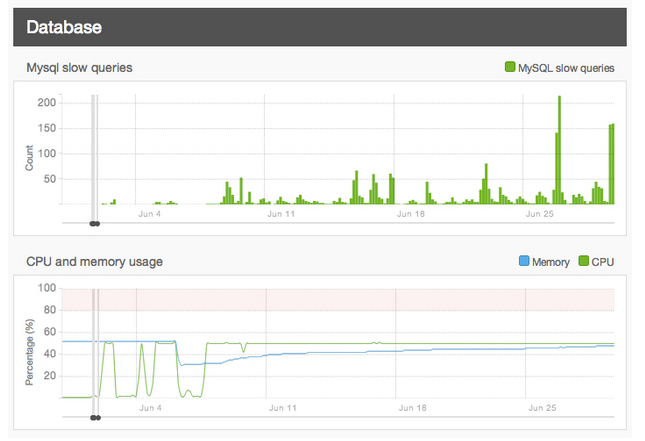
Slow Queries
When we use the term “slow query,” we’re referring to a database call that takes longer than one second to complete. On their own, these can be a minor inconvenience, but if they are left unaddressed, a traffic spike can turn even a few one-second slow queries into a period of site slowness or downtime.
There are two common sources of slow queries we see on a regular basis: complex Views and custom database queries, particularly those with a lot of LEFT JOIN or INNER JOIN components. If your site is experiencing slowness, it may be worth downloading your slow query log from the Logs section of our site, or using one of our add-ons like New Relic to see if slow queries are, in fact, to blame. You can also use our Server Health (on Acquia Cloud Professional) or Platform Health (coming soon to Acquia Cloud Enterprise) to see how often slow queries do impact your site, then attempt to determine if they correlate with perceived site slowness.
You can learn more about searching for and fixing slow queries here.
Caching Issues
Caching is often times the saving grace of a busy website, and it comes in many forms. Drupal comes with a built in form of caching which helps speed up page requests if it’s enabled on a site’s Performance page. That same functionality can be extended beyond page requests to cache things like blocks, entities, and Views, further improving performance.
Our platform also utilizes a form of PHP caching commonly called “APC” or “OpCode Cache” which increases the speed of backend page requests.
Then there’s the Memcache module, which can be installed on a site to take advantage of more advanced database caching.
Finally, there’s external caching via services like Varnish on our platform, or via Content Delivery Networks (CDNs) like Akamai or Amazon’s CloudFront. These forms of caching store a version of the page which has already been served to a previous visitor and serve it to subsequent visitors for a specific period of time. The longer that items are stored in external caching systems, the lesser the load on your backend servers. We generally recommend a value of 5 minutes or more, but many sites with less frequent updates default to 1 hour.
Now, onto the actual issues associated with these forms of caching.
One of the most common issues related to Drupal caching occurs when new code is deployed or committed without a subsequent cache clear. Issues can also arise when a database is copied between environments without a cache clear. What is perhaps most surprising about this is that the issues do not always occur right away. We have many times seen sites go down hours or days after code was deployed, and the root cause was that cache was never cleared.
Issues with APC/OpCode Cache are very rare on our platform, but the most common issue we see is that APC is insufficient for the needs of a larger or more complex site. In these instances, a warning message will appear in a site’s logs which says, “Unable to allocate memory from pool.” This simply means that page requests are slower than they could potentially be (though by how much is arguable), and the resolution is to increase the amount of memory available to APC slightly. This can be done via the Configure tab for each environment on your Workflow page if you are using our Acquia Cloud Professional platform, or we can perform this change for you on Acquia Cloud Enterprise.
A variety of issues can also occur with Memcache, and many of those are most easily tested by commenting out the code which enables Memcache in your settings.php file to see whether or not it is responsible. If it is, then more targeted troubleshooting can begin.
Some customers may also find that Memcache is not ideally tuned based on the needs of their site, and as a result, they might not be seeing the benefits they expected. Monitoring Memcache usage and tuning it for optimal performance often requires a specialist, which Acquia can provide, but for most use cases, simply having the module and functionality running will provide a marked performance improvement at the database layer.
When it comes to external caching, there are generally two types of issues we see - things are staying in cache longer than they should, or requests are bypassing cache and causing extra load on the backend servers.
News sites, for example, tend to suffer most from the former issue. They need content to update as quickly as possible to stay ahead of the competition, and if visitors aren’t seeing the latest version of an article, then they might go elsewhere for updates. For customers who need pages to expire from cache when changes are made, we often recommend the Acquia Purge and Expire modules.
For static files that stay in cache longer than expected, this value is often set in .htaccess files and generally defaults to 2 weeks or more, but it can be changed to a different duration based on the needs of the site.
The latter issue mentioned above - requests bypassing cache - can bring an otherwise stable site to its knees. There are multiple causes here, but the most common comes in the form of a session cookie being set for anonymous visitors, for example, by advertising and tracking systems on a site. This can be confirmed by opening a browser’s debugging console when browsing the site anonymously and searching for a cookie with SESS at the beginning of it.
This can also be caused simply by not having caching configured correctly, or by having specific pages set no-cache headers via custom code.
External Services
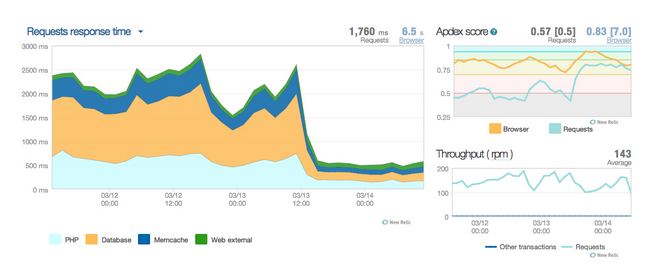
Calls to external services are integral to the functionality of many websites, but these can also become a point of failure if the external service begins to experience performance issues or goes offline. For example, let’s say your homepage connects to a remote site to pull in content or data. If one of those sites slows down or goes down, then every request to your homepage might, as well.
Seeing the slowness or sudden outage, a developer’s instinct might be to either add more hardware or revert any code or configuration changes which happened to have taken place at around the same time. They might even start searching the logs for slow-running database queries or fatal errors to explain the behavior, only to learn after ruling all else out that their remote service was to blame.
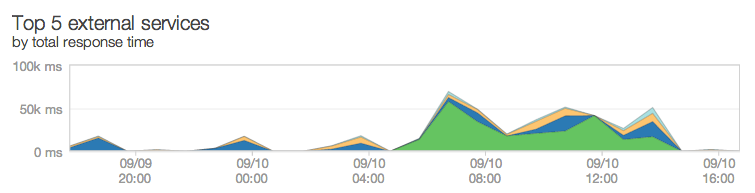
Tools like New Relic can be used to identify when site slowness and outages can be attributed to specific external calls. You can also use some browsers’ debugging consoles to see how long external calls are taking when a page renders, then pinpoint which ones are the slowest at any given point in time. Often times, we will use both for real-time troubleshooting.
To mitigate the risk of this happening on your site, we generally recommend that sites are configured to query external services after the page fully loads, as this allows the site to continue serving most or all of its other regular content regardless of how long the external calls take.
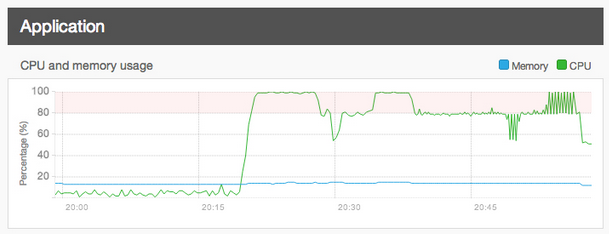
Resource Exhaustion
There are typically three resources which can become exhausted on a server - CPU, memory, and storage. The servers on our platform are carefully tuned to find a balance between maximum available PHP processes (to handle uncached page requests) and minimal risk of resource exhaustion. We also carefully monitor our servers for signs of distress resulting from circumstances which can override or push the limits of these tunings, and we proactively notify customers or take proactive action when site or server stability is at risk.
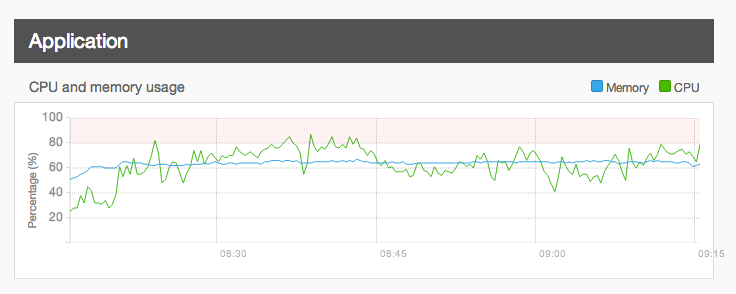
There are a variety of circumstances which can lead to server or site instability regardless of the barriers and tunings put in place to counter it. The most common involves high PHP memory limits. On our platform, we default to 128 MB per process, and we tune our servers accordingly knowing that each PHP process will generally use a certain amount of CPU to complete.
Some sites require more memory to load some or all pages, though, and as a result, we sometimes see customers raise their PHP memory limit (or request that we raise it) to higher values like 192 MB, 256 MB, or, in rare cases, values as high as 512 MB or 1 GB. This not only reduces the number of available PHP processes we can allow on a server, it also increases the likelihood of resource exhaustion, especially if done via settings.php override, because background processes like cron, MySQL, and the database (which all need memory, themselves) are not taken into account.
To combat this, we are working to develop and perfect new systems which allows servers to determine how much memory is actually being used, as well as how much is free, and then determine whether or not it is safe to spin up more PHP processes. This new system would also allows you or us to specify if certain environments should be process-limited so that more resources can be allocated to other environments.
Until then, when we see customers begin down a path toward unusually high memory limits, we generally recommend that they carefully review their actual needs, then determine what memory limits are really necessary. For example, in most cases, higher memory limits are only needed on very specific pages or path patterns, so we recommend conditional memory limit overrides in those scenarios. Modules like Memory Profiler can help in identifying those specific pages, and in many cases, code or configuration changes can be made to reduce the memory required by these pages to safer levels.
We also see instances where multiple sites or docroots are installed on hardware that is not powerful enough to sustain activity on all or many of them at once. This is often done to save money, but comes with a significantly higher risk of site slowness or instability during periods of heightened activity because there aren’t enough resources to safely serve that many active sites.
With respect to CPU issues, these are less common on our platform thanks to our careful tunings, but they can still occur when elaborate queries are executed, or complex cron or site operations are underway or overlapping. These issues often present as site slowness, but can be more difficult to diagnose because they do not result in log messages.
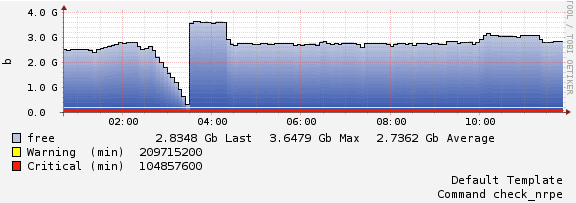
Finally, with respect to storage, it is not uncommon to forget about the storage capacity of your servers, especially over time as the site grows, or after a large file transfer. If storage runs out on a server, any sites on it may immediately stop working or become impaired since there is no more space for changes to logs or databases, so it is important to keep a watchful eye on how much space your site, databases, and files are using over time.
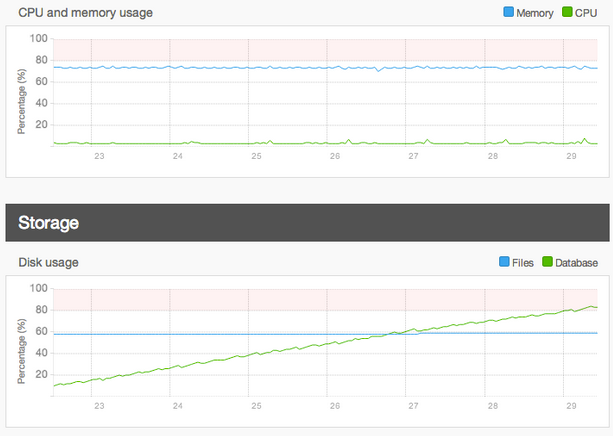
For these reasons and many more, we have been working hard to develop and improve new features like Server Health (Acquia Cloud Professional) and Platform Health (coming soon to Acquia Cloud Enterprise), both of which make it easier for customers to monitor server resources and correlate issues with specific events like traffic spikes, Varnish cache clears, and code deployments.
This is also why we notify customers proactively if we detect server stability issues.
Other Issues
The above list is comprised of the most common issues we see on a day-to-day basis, but there are many obscure or site-specific issues that we see which also require time and expertise to diagnose.
For example, most companies and organizations will never have to worry about issues with database tables or read/write files getting locked and their sites going down. Most development teams do not need to write advanced custom code to accomplish certain uses cases, so they will not encounter scenarios where infinite loops appear and cause segmentation faults on a server. Only a few might use a specific module or attempt a certain configuration and not realize what consequences or conflicts could arise as a result. Issues like these require experience and resources to diagnose that most teams do not have access to, but we do.
On the Acquia Support team, we are very fortunate in that we have dozens of experts across the world, each with their own specific skill sets and years of unique experience developing, maintaining, or fixing complex sites. So, when issues do arise and the root cause is not readily identifiable, our customers always have a variety of specialists at their disposal to aid in diagnosis and resolution.
Having multiple eyes on an issue has a number of benefits. When problems arise, we can pursue multiple avenues and run a variety of tests to try and rule out possible causes. We can also review the wide variety of data sources available to us simultaneously and quickly compare the results to focus our efforts on the avenues most likely to pay off. Then, when it comes to resolution, our combined experiences allow us to provide the safest and most efficient recommendations for a stable, secure, and scalable site.
There is a certain peace of mind that comes with knowing that so much experience with troubleshooting, fine-tuning, and future-proofing a site is at your disposal.
Putting It All Together
All sites and businesses have needs. They need to deliver content in a certain manner, or at a certain time, or on a certain budget. As a result, optimizations and troubleshooting often take a backseat to hitting milestones or keeping costs low.
There is a certain art to striking a balance between all these needs and still keeping the site stable and performant. So many factors contribute to both, and the above issues are just the tip of the iceberg. Features like our Insight tool help expose a number of other application-level risks associated with security, performance, and best practices, but some things require a developer or troubleshooter to carefully look for symptoms that cannot readily be flagged without manual inspection and analysis.
When a site begins experiencing issues or slowing down, there are a variety of tools and resources you can use to figure out what’s going wrong. In many instances, Acquia’s technical teams are your greatest tools since we can often quickly assess the full scope of an issue and start narrowing down the root causes quickly - many times, without you or your visitors ever noticing something was wrong. We can often also quickly provide insight into steps to mitigate issues or reduce the risks associated with them.
All of that said, however, you can use many of the same tools and resources to monitor and test for issues before they happen. By making optimal use of caching mechanisms, and routinely ensuring they work properly, you can significantly reduce the load on your servers and also maintain lower hardware costs. The same can be said of optimizing your site’s memory limits, Views, and custom database queries.
Additionally, careful integration of remote sites and services can ensure that their uptime and performance issues do not impact your own, and a watchful eye on your server resources can help you familiarize yourself with the limits of your hardware during certain activities and events.
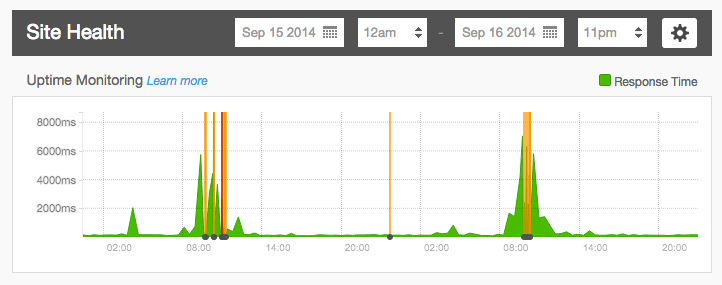
Tools like New Relic, TraceView, Server Health, Platform Health, Uptime Monitoring, and Log Streaming can be used to give you real-time or near-real-time insight into the current and historical health of their servers and applications, and they can be used to great effect when looking for bottlenecks that can slow or take sites down, especially during traffic spikes and load tests. Understanding how to scan and read a site’s log files can also help pinpoint issues.
You may not always be able to address every issue you find, but at least if you know what conditions could lead to issues down the road, steps can be taken in the short run to address them before they have a chance to cause bigger issues in the long run.
And, if you find that you need guidance or help along the way, you can always count on Acquia’s Support and associated technical teams, and our advanced monitoring systems, to help you keep your sites running smoothly, get them back online if issues do arise, and advise you on plans for future improvements and growth. That’s what we’re here for - to help ensure your success.